
|
The COVID-19 crisis has shaken up life in many different ways. Businesses, in particular, have had to adapt to the post-pandemic reality. Some have succeeded and even grown, while others have succumbed to the tough financial climate being experienced by countries all over the world.
In this article, we assess employment trends in the first two quarters of 2020 in the U.S. – how many businesses had to downsize or close down altogether? How many new ones were able to survive and thrive? Using business variables, such as establishment age and number of employees, as well as taking a look at growth and loss on a state-by-state basis, we explore how establishments (and their employees) have been faring across the country. Read on to find out more.
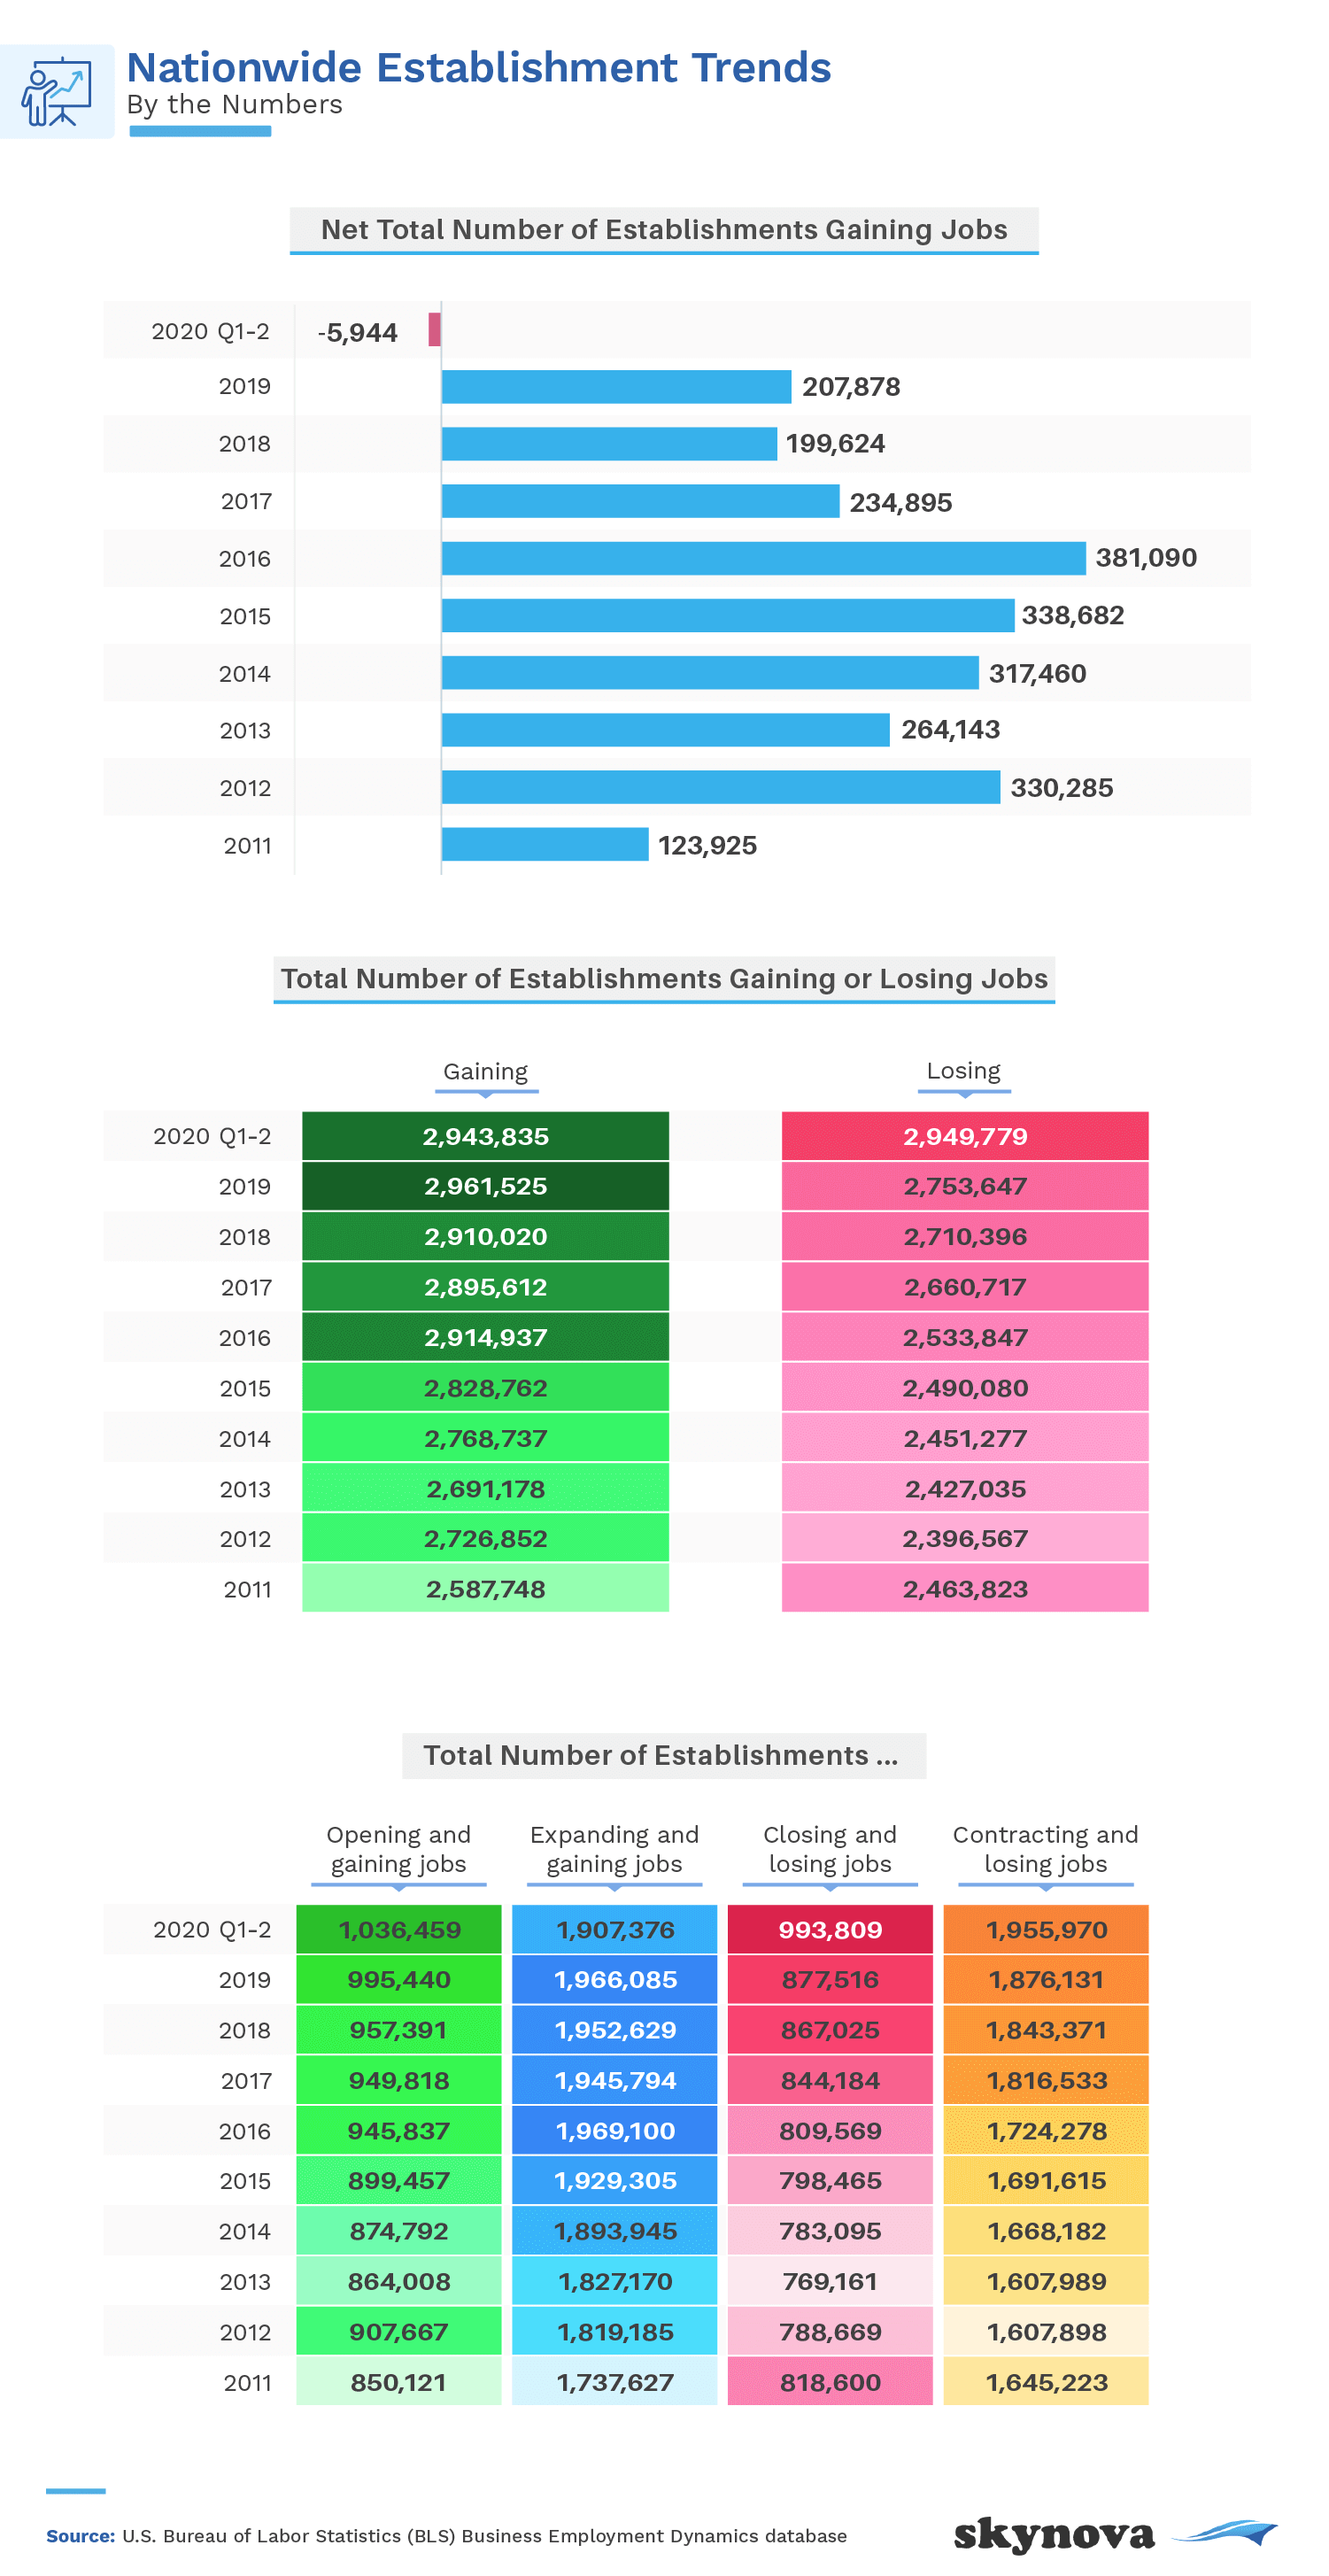
From 2011 through 2019, there was a net positive number of jobs created in the U.S., the highest being in 2016. Although the trend remained positive, numbers dwindled from 2017 to 2019, and for the first time in a long time, there was a net loss in the first two quarters of 2020. Over the past nine years, the trajectories of establishments both gaining and losing jobs have been fairly similar, although losses took a significant leap in the first half of 2020.
In early 2020, over a million establishments opened, and almost 2 million were in the process of expanding, but just under a million were closing, and nearly 2 million were downsizing. This resulted in the overall negative job loss. The COVID-19 pandemic has played a major role in job loss around the world. In March 2020, the unemployment rate in the U.S. rose by 0.9 percentage points to 4.4% – the largest monthly increase since January 1975.
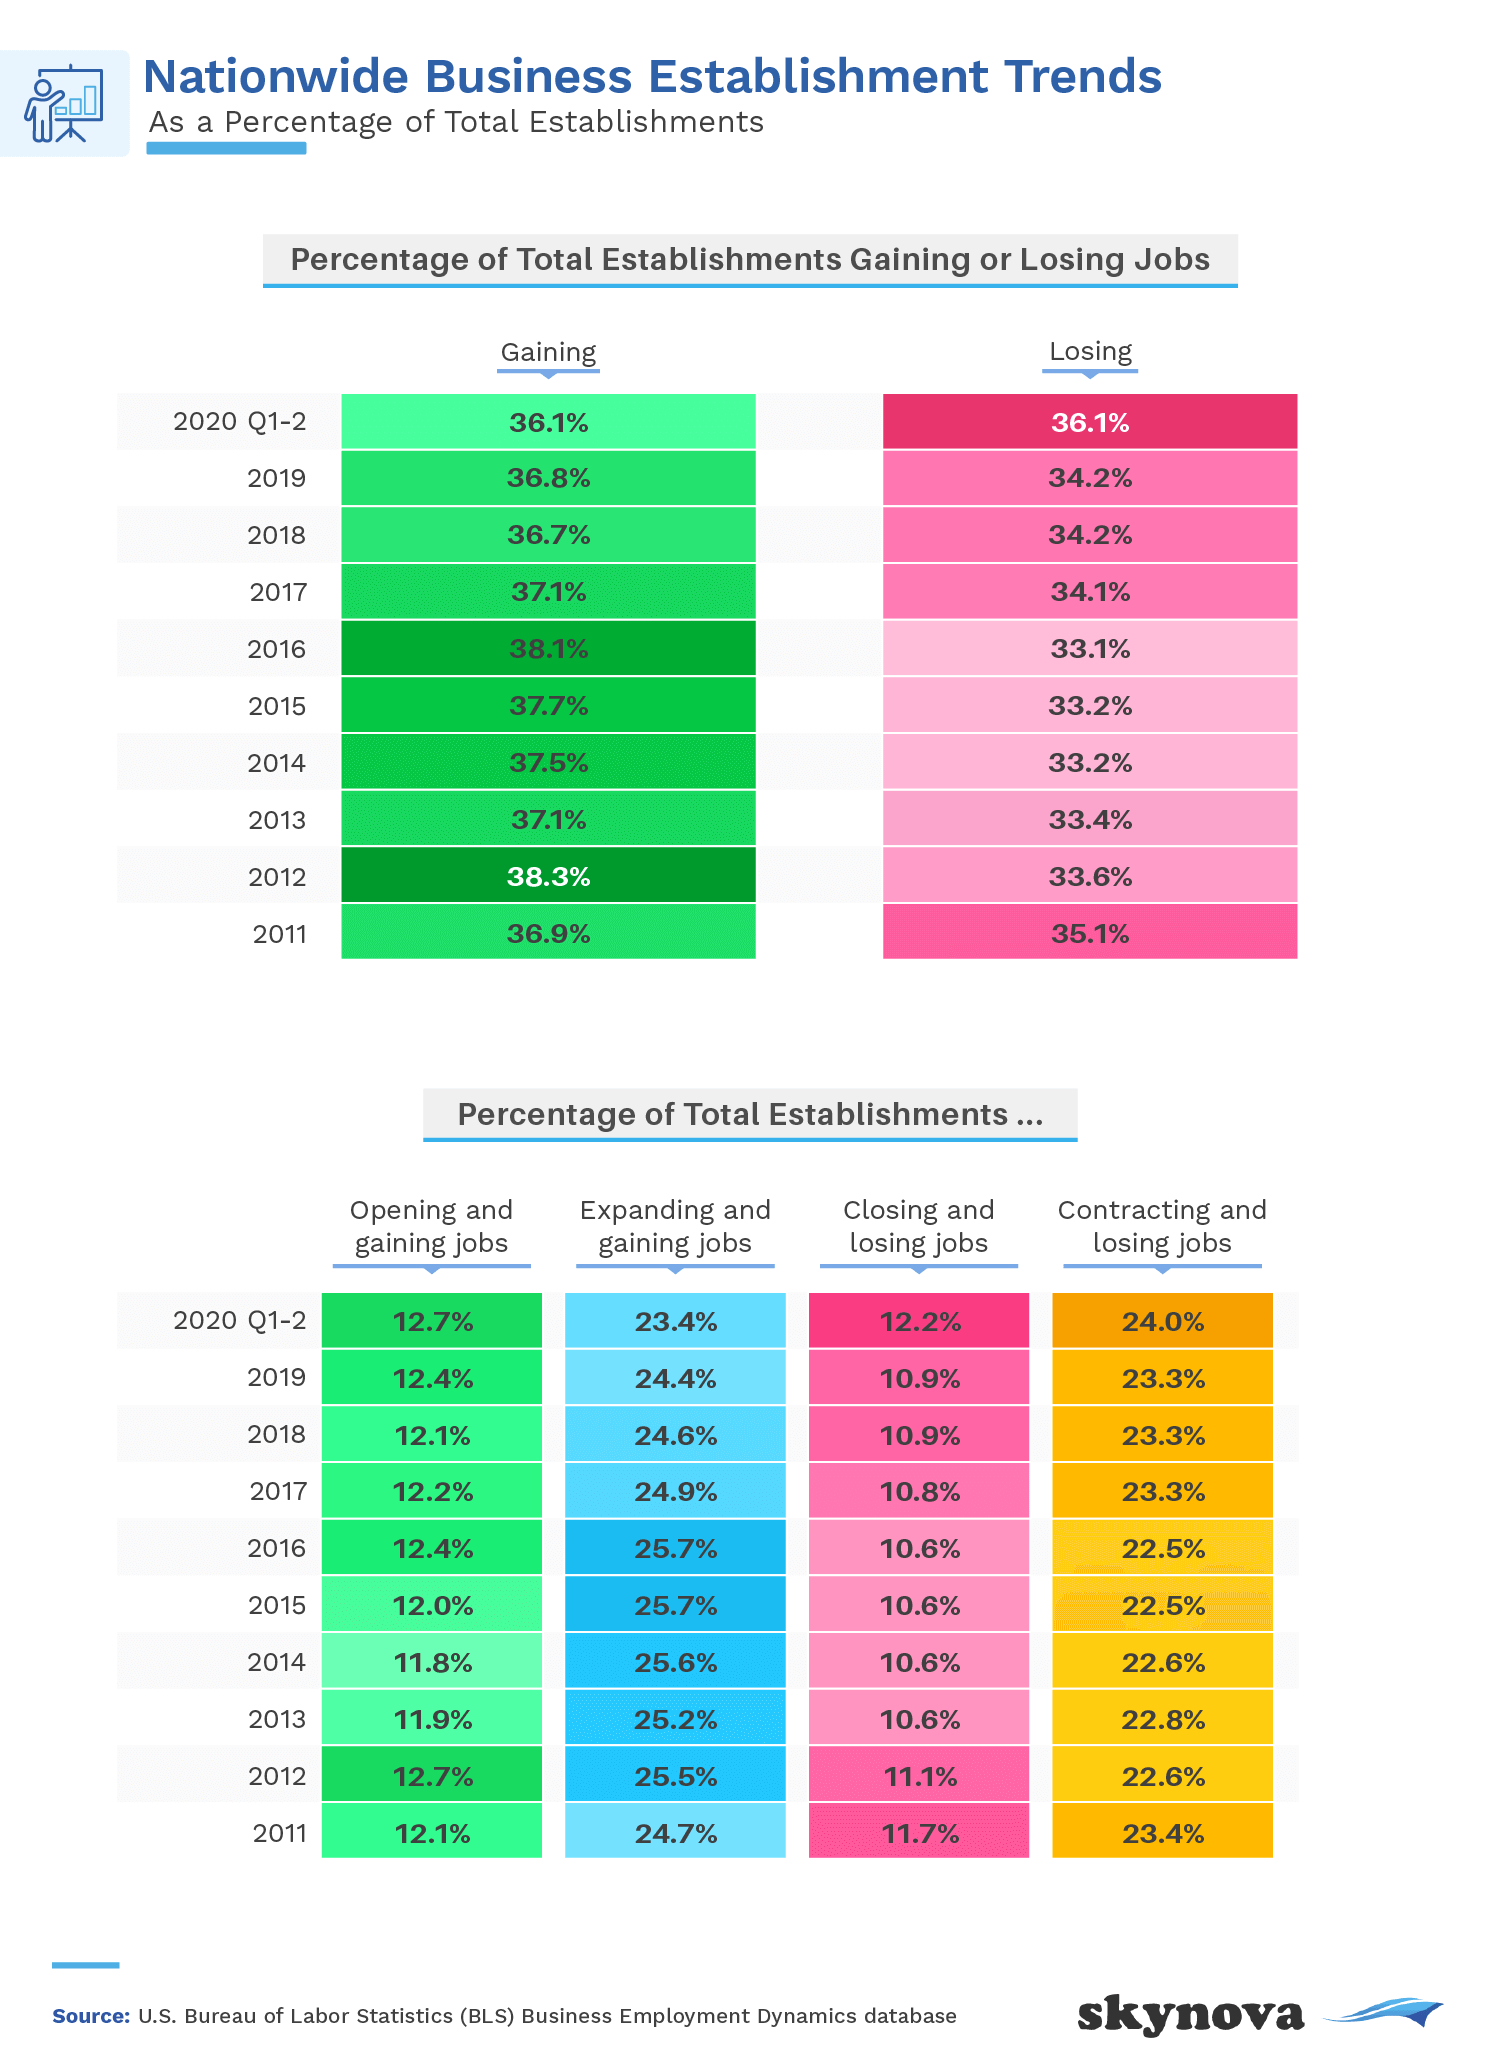
The net job loss for the first two quarters of 2020 was quite small, which is why when expressed in percentages, both gained and lost jobs for this period sat at 36.1%. The percentage of establishments creating jobs experienced a downward trend from 2017 onwards, whereas the losses remained fairly stagnant until the first half of 2020, when the percentage shot up by just under 2 percentage points.
While there was only a 0.3 percentage point increase in establishments opening and creating jobs from 2019 to the first two quarters of 2020, a 1.3 percentage point increase was seen in establishments closing and losing jobs in that same time frame. Slightly more establishments contracted than expanded as well. While it may look like the losses weren't that significant, the reality is that a whopping 114 million people lost their jobs throughout 2020.
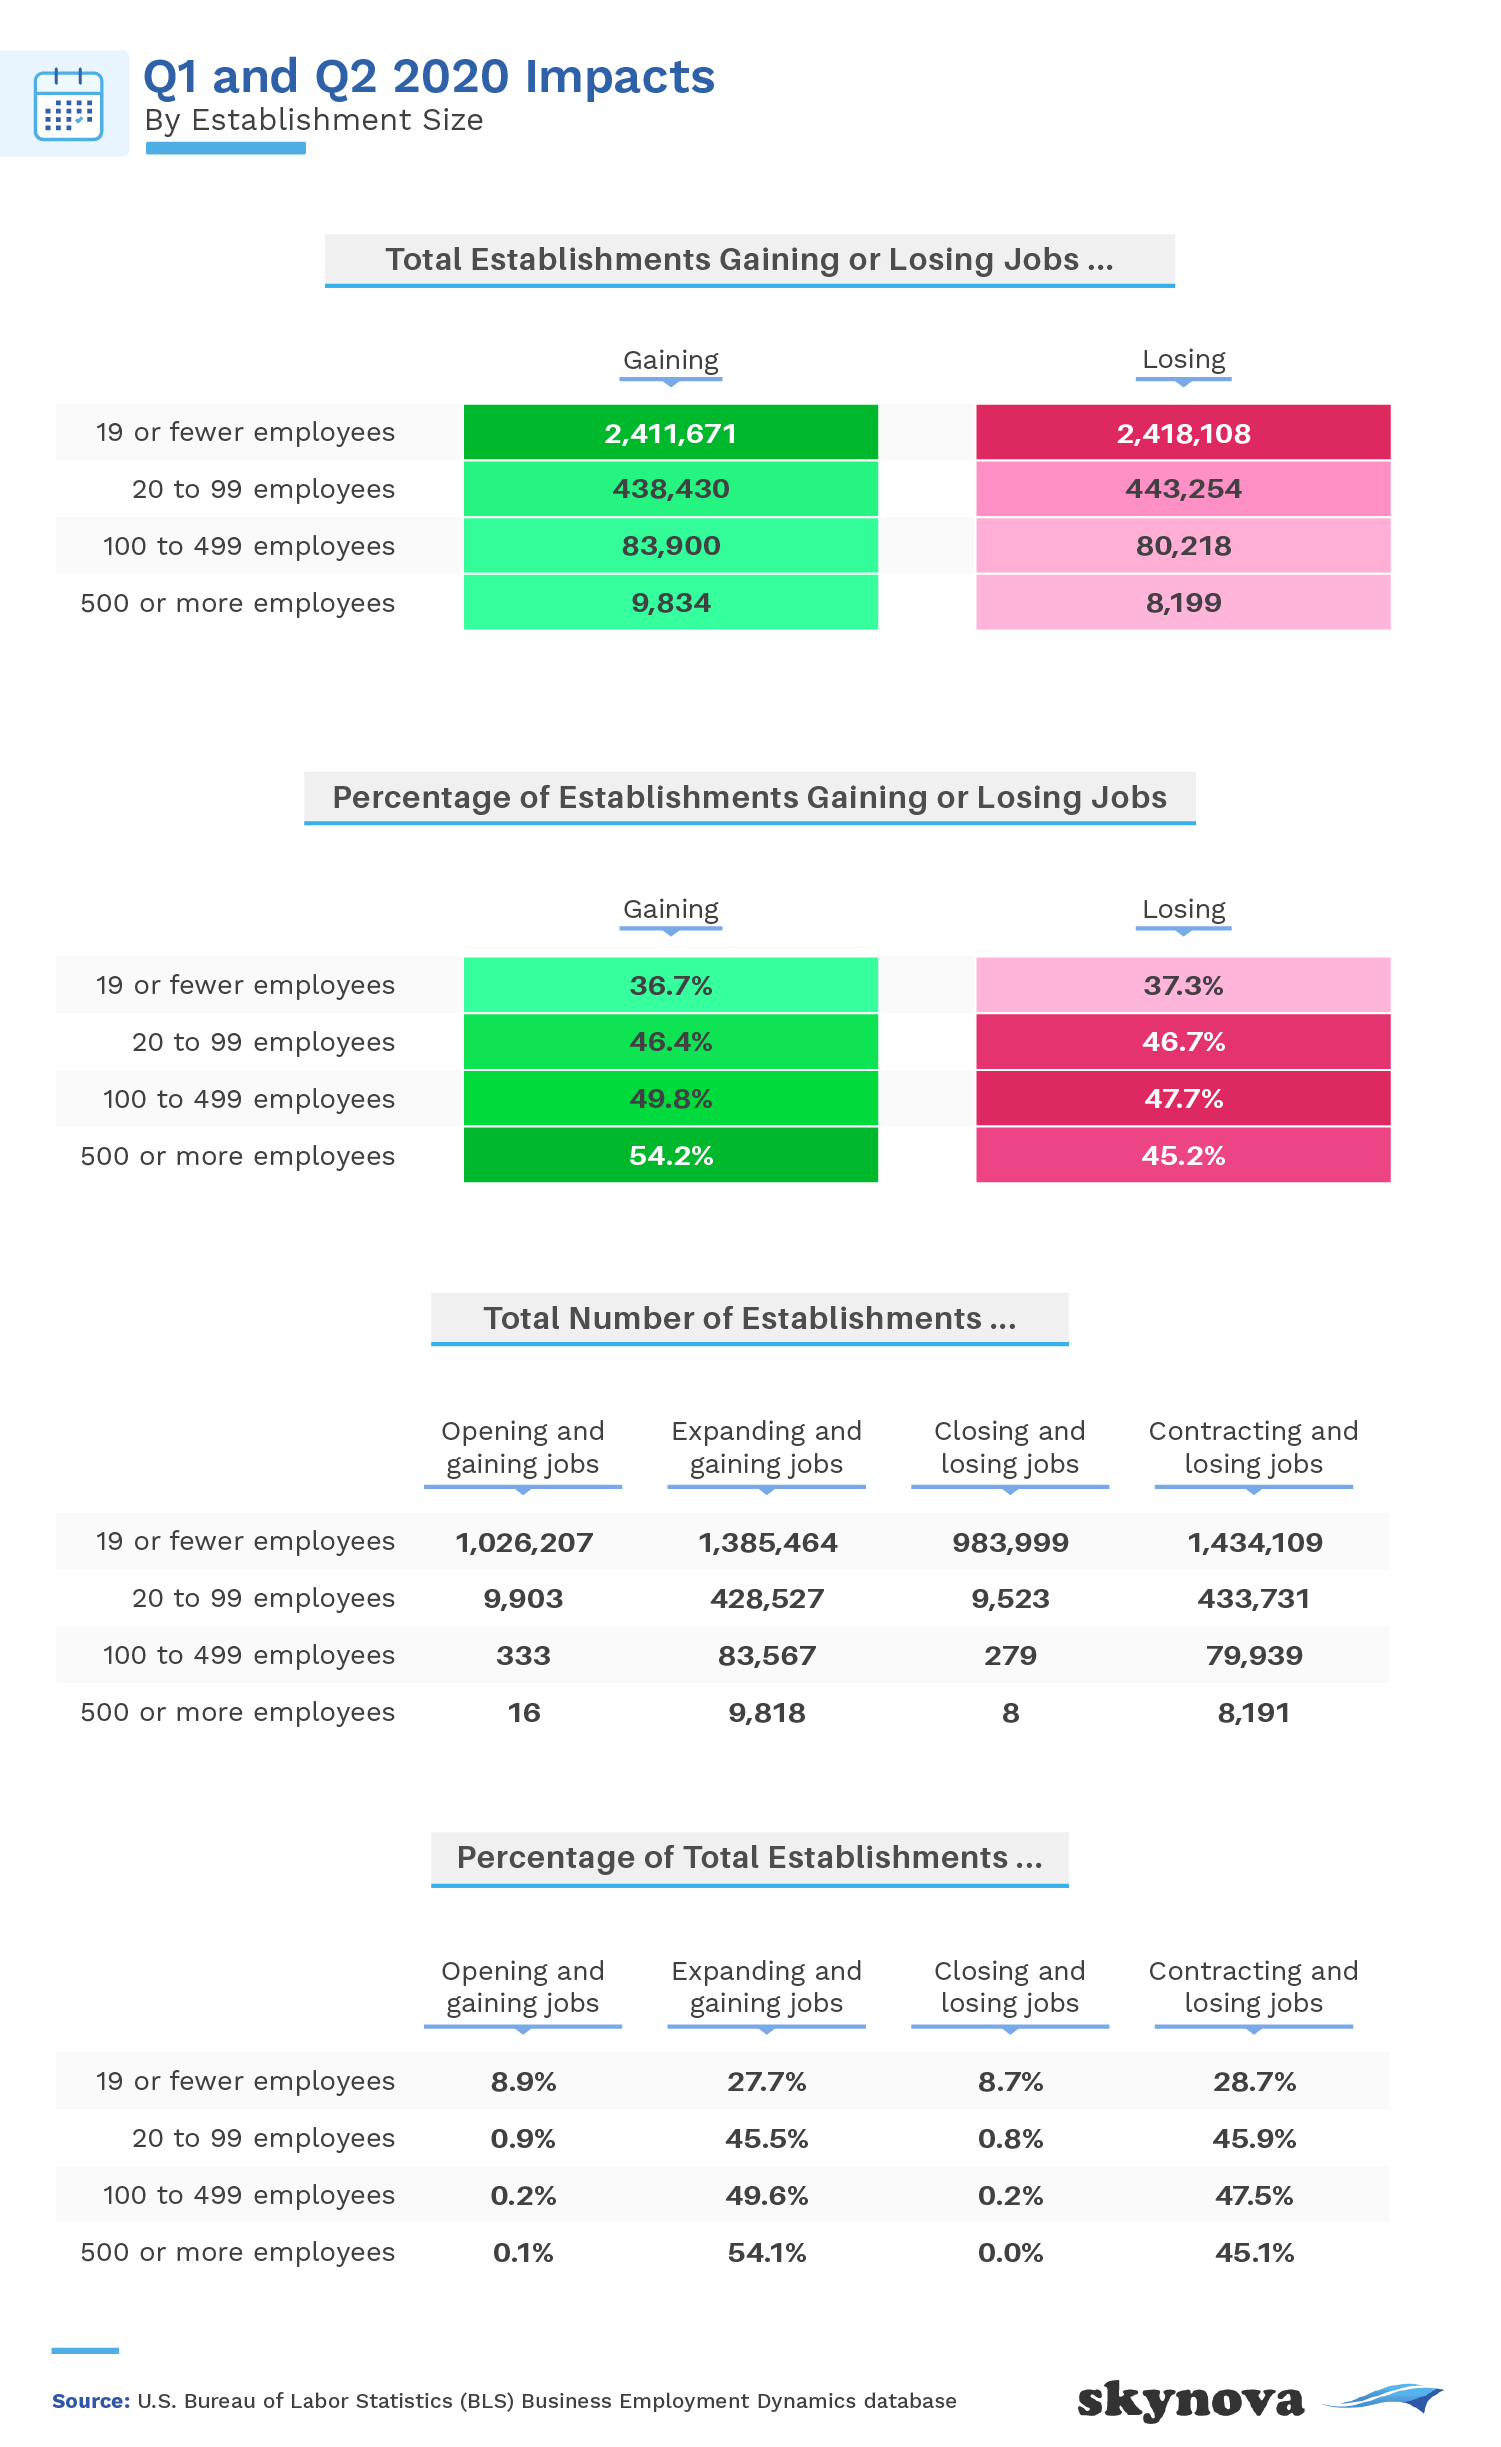
For establishments with 19 employees or fewer, roughly 2.4 million businesses gained and lost jobs respectively in the first two quarters of 2020. As company sizes got bigger, numbers for job gains and losses started to dwindle at a very similar rate. The opposite reaction occurred when these figures were expressed in average percentages – the bigger the company, the greater the percentage was for job gain. Out of more than 18,000 companies with 500 or more employees, 54.2% of them experienced job gain. On the other hand, of over 4.8 million companies with 19 or fewer employees, only 36.7% reported an increase in job creation.
Although a greater percentage of companies of all sizes reported expanding versus opening (or contracting versus closing) smaller companies (20–99 employees) were much more likely than larger ones to close down completely in the first half of 2020. This suggests that large companies have the luxury of being able to downsize without having to close down for good, whereas the future of small businesses is much less certain – they have less brand recognition and smaller budgets and cannot compete on price with major corporations.
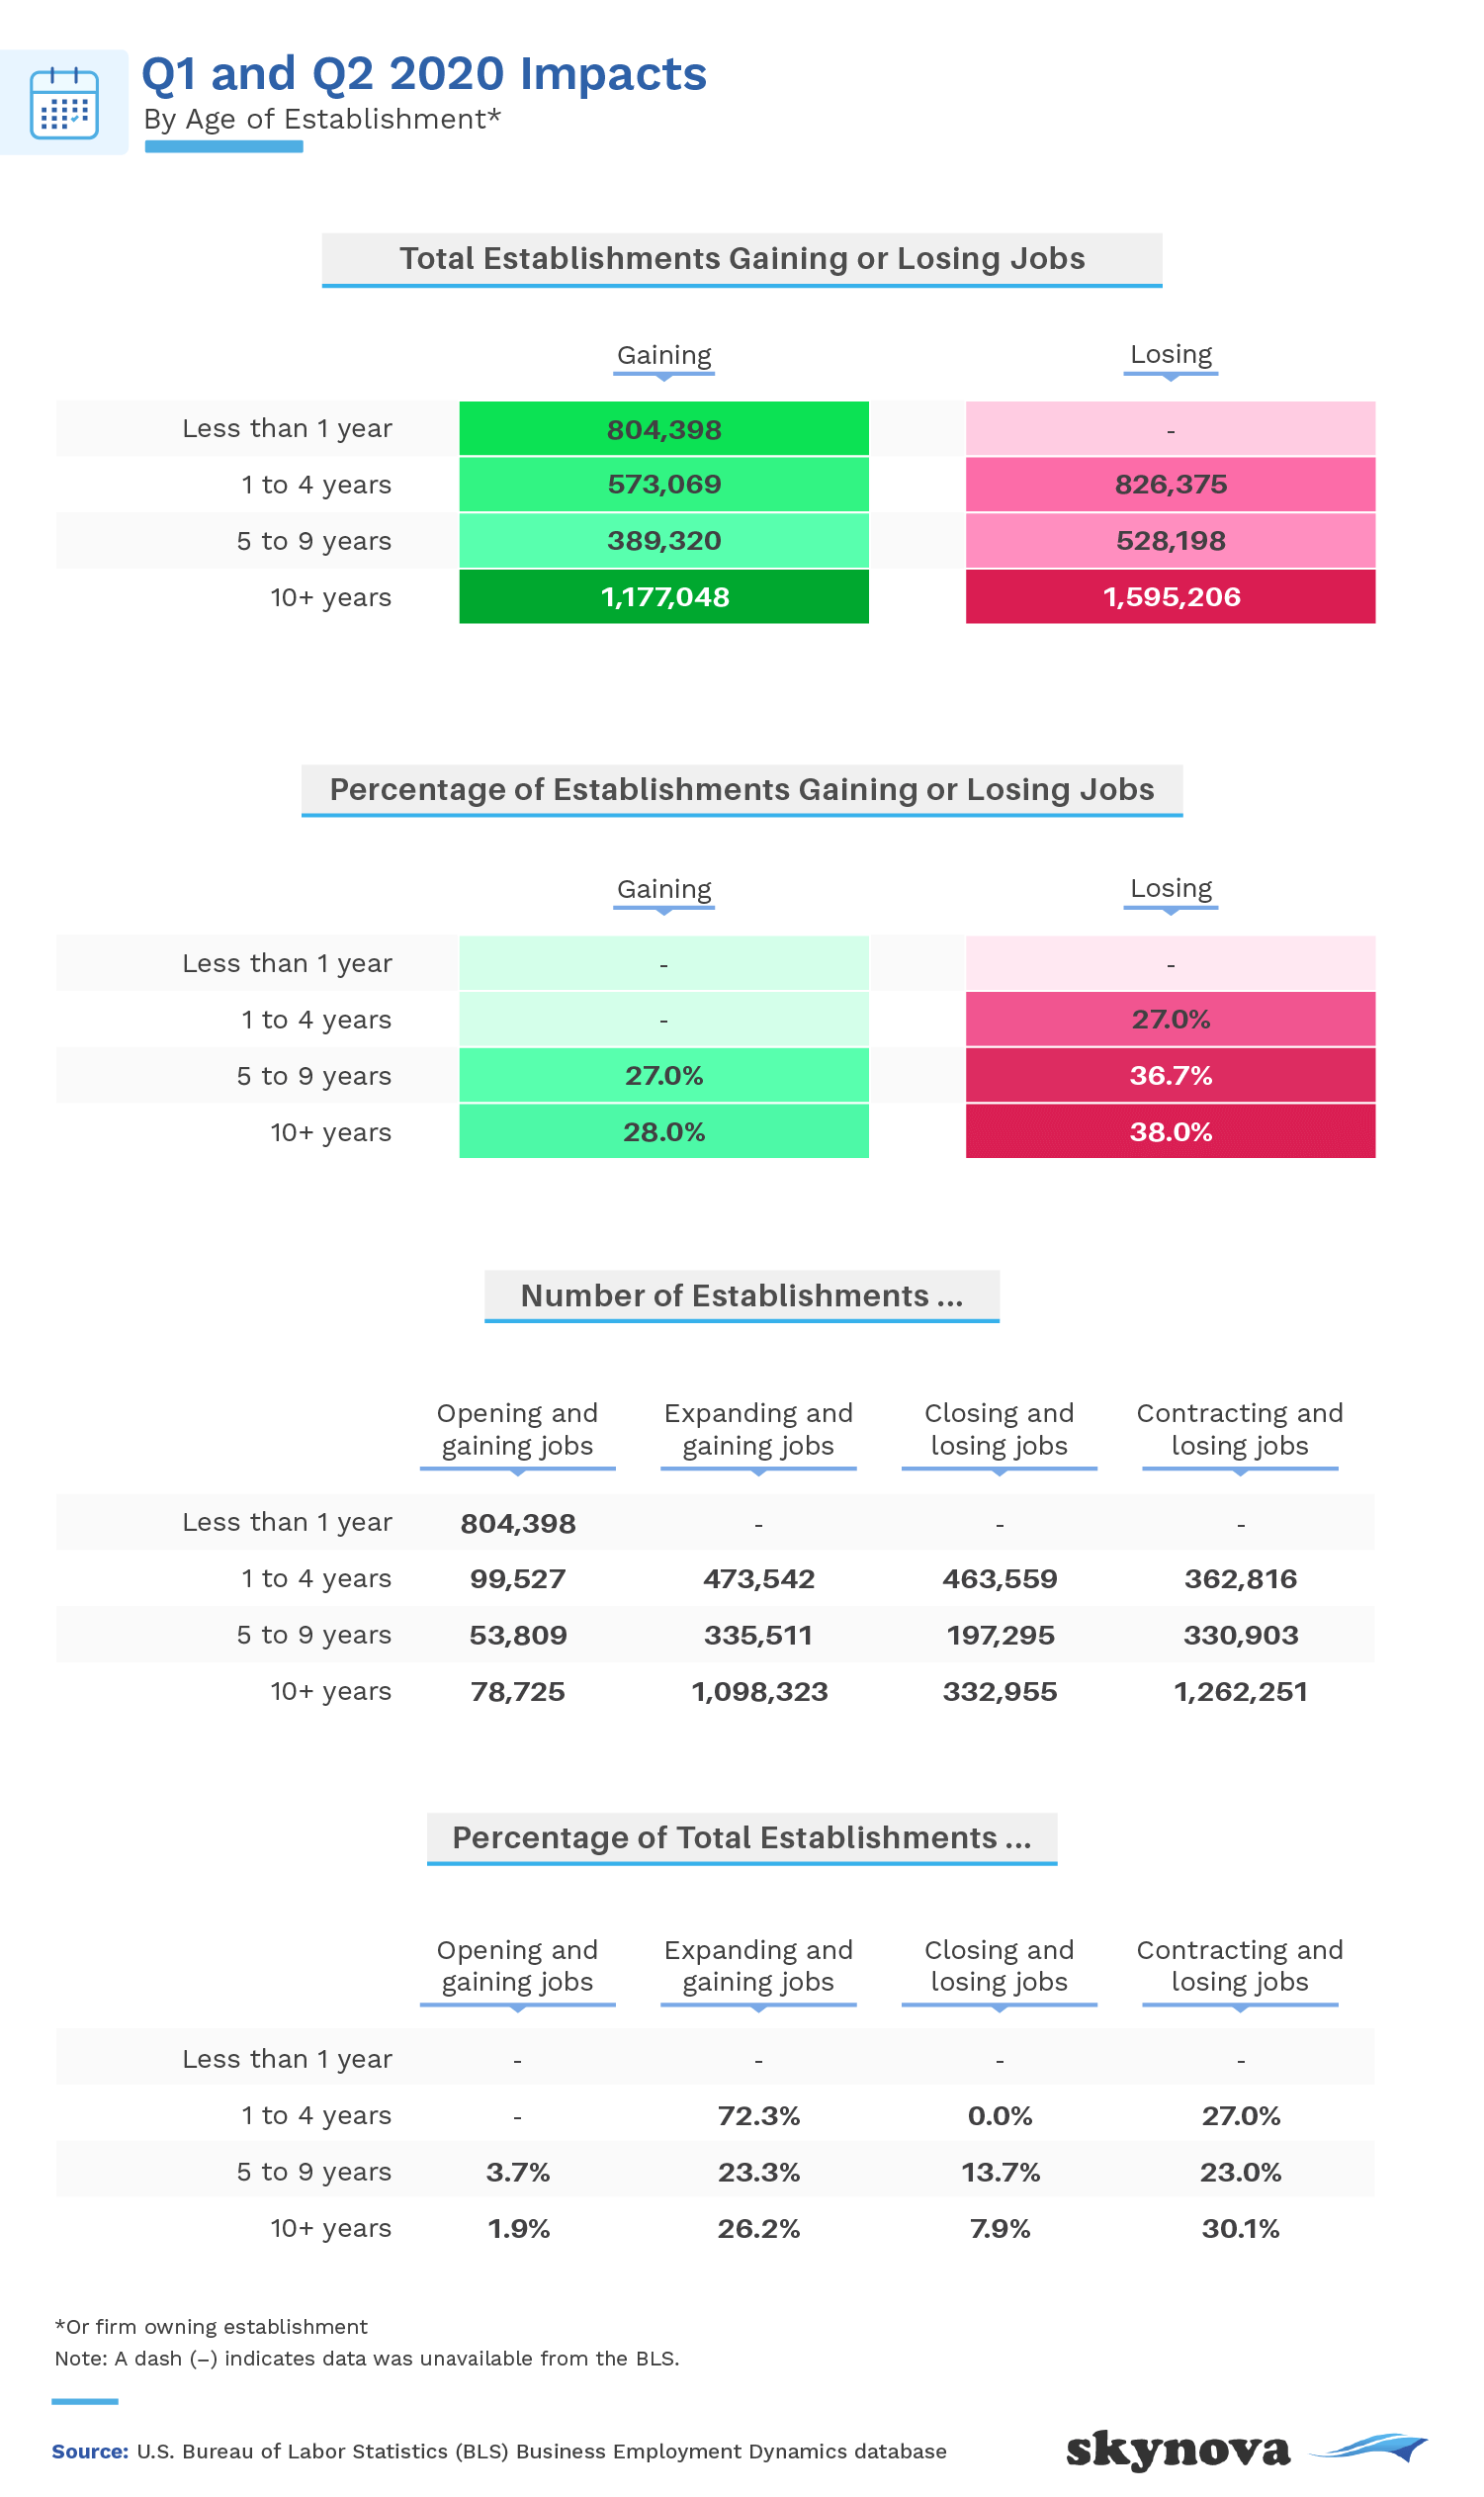
During the span of time in 2020 studied, over 800,000 establishments aged less than a year old experienced positive job gain, and none experienced a loss. Businesses that had been established for a year or more tended to experience more losses than gains, with the greatest percentage of losses occurring in businesses that had been around for 10 years or more.
While there were slightly more expansions than contractions, businesses that were between five and nine years old experienced a lot more closings than openings. Businesses 10 years and older experienced more closings than openings and more contractions than expansions. The retail, bar, and restaurant industries are among those that have been hit especially hard as a consequence of the global pandemic.
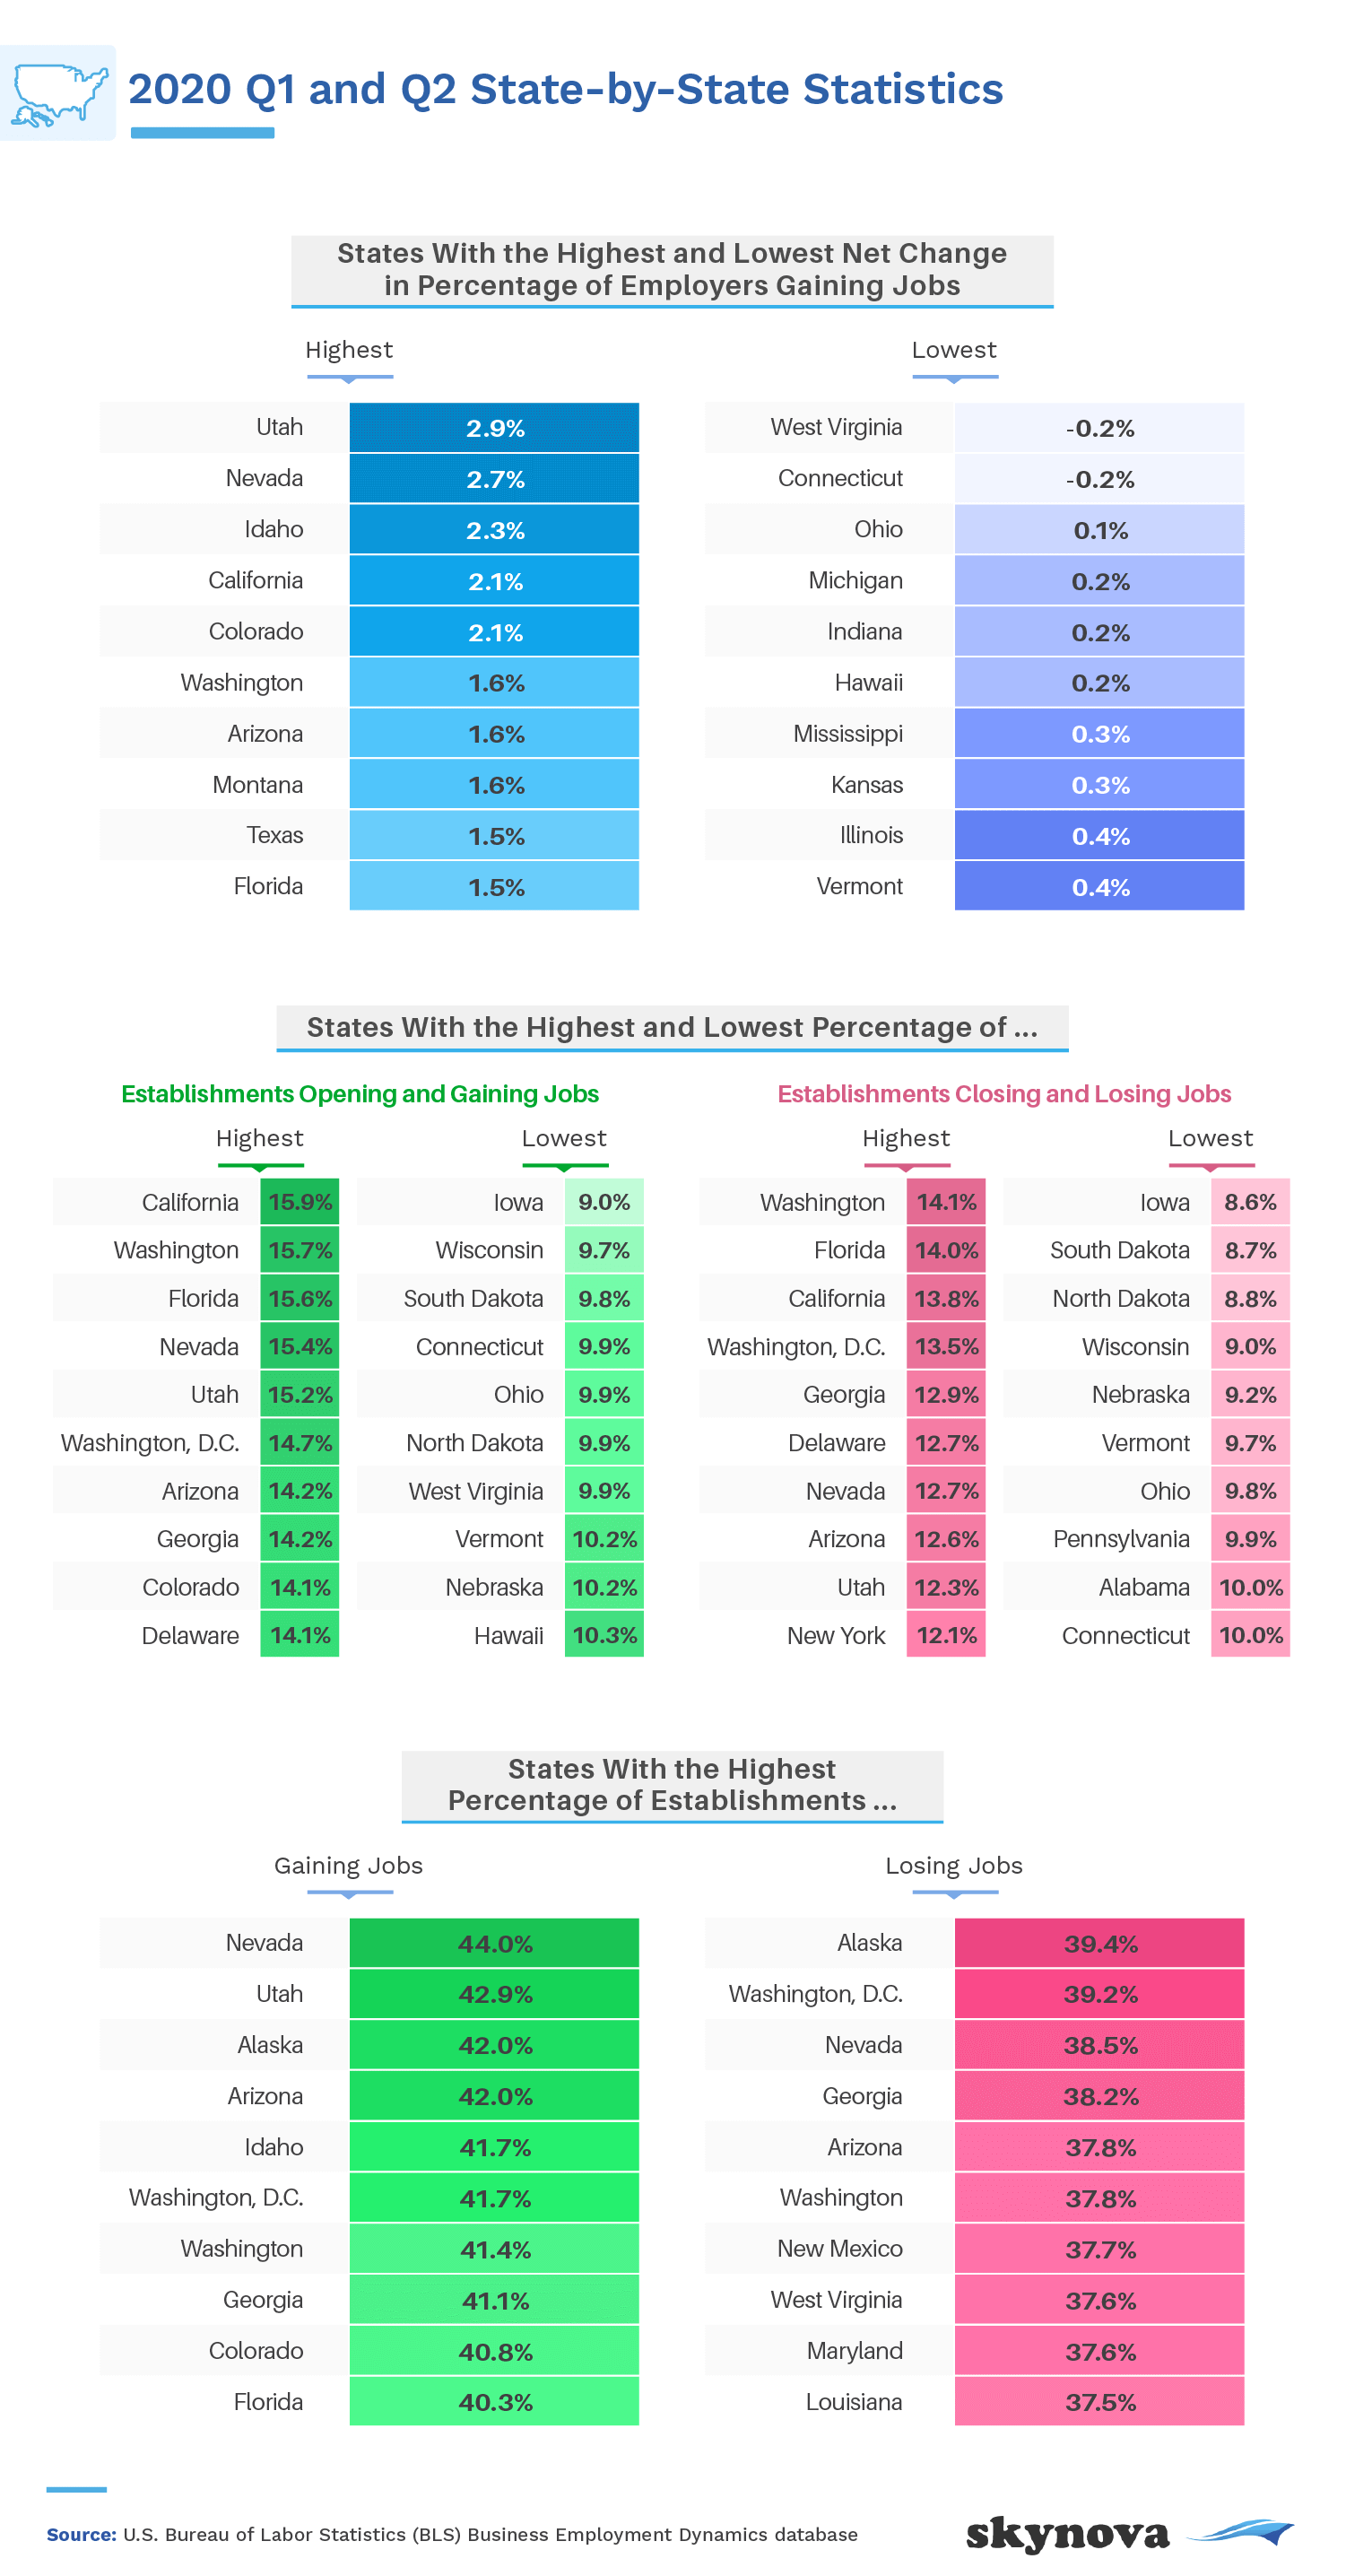
On a state-by-state basis, Utah had the highest net change in establishment job gains at 2.9%. West Virginia wasn't doing so well, ranking bottom in the country with a net loss of 0.2%. Overall, the state with the highest percentage of establishments opening and increasing jobs was California at 15.9%. Ironically, Washington came in second in this category at 15.7%, while also ranking the highest in terms of the number of establishments closing and reducing jobs.
Establishments in Nevada and Utah recorded the highest percentages for job gain. Meanwhile, Alaska and Washington, D.C., were the top two on the less ideal side of the spectrum, with Nevada following closely behind. Clearly, establishments in some states are undergoing similarly high numbers of hirings and firings. That being said, while there was a significant spike in unemployment from March (4.4%) to April 2020 (14.7%), by the end of the second quarter it was down to around 11% and has come down a lot more since.
As mentioned, the spread of COVID-19 has affected businesses all over the world, but for the purpose of this article, we focused solely on the U.S. landscape. The first two quarters of 2020 represented the first time in a long time that the country experienced a net job loss, outlining the negative impact the pandemic has had upon the economy.
We also learned that larger companies naturally had more leeway when it came to sustaining their businesses – smaller ones generally don't have nearly as much financial backing or brand recognition. Also, older businesses were more likely to downsize or completely shut down in comparison to ones less than a year old. Lastly, when analyzing establishments by state, gain and loss fluctuation was common among them.
While the first half of 2020 was turbulent financially, things have been looking up, and there is hope that an increasing number of establishments will soon be able to resurface and thrive once again, in addition to the new ones that are already making strong pushes to succeed.
Skynova specializes in online invoicing for small businesses, but our many other software modules are designed to work in tandem and cover all your organizational needs. We also enjoy producing articles that our customers can benefit from. These generally revolve around business and the workplace, while sometimes incorporating other areas of society. In this case, we've explored job gains and losses using different business variables. Our articles are based on primary research that is conducted in house to provide our readers with interesting insight and perspectives.
For this study, we analyzed data from the U.S. Bureau of Labor Statistics, specifically their Business Employment Dynamics database. To complete this analysis, we aggregated, processed, and collated data from over 50 separate documents within this database. For more information on the Business Employment Dynamics data, visit https://www.bls.gov/bdm/.
Feel free to share this article with someone who might like to learn about the employment landscape across the country. We just ask that you do so for noncommercial purposes and to provide a link back to the original page so your readers have access to our full findings and methodology.